Chart.js とは
折れ線グラフ、棒グラフ、円グラフ、レーダーチャートなどのグラフが簡単に描けるJavascriptのライブラリです。
HTML5のCanvasを使って描画され、表示の際の気持ちいいアニメーションの動きが特徴的です。とても分かりやすいマークアップなので、誰でも簡単に編集ができるようになっています。すべてのモダンブラウザで表示可能で、IE7から対応しています。
Chart.js · Chart.js 日本語ドキュメント
https://misc.0o0o.org/chartjs-doc-ja/
ここでは、利用する機会が多い以下の6種類のチャートの利用方法とサンプルを記載しています。
- 折れ線グラフ
- 棒グラフ
- レーダーチャート
- 円グラフ
- ドーナツチャート
- 鶏頭図
デモページ
https://demo.isystk.com/nuxtjs/chart/
折れ線グラフ
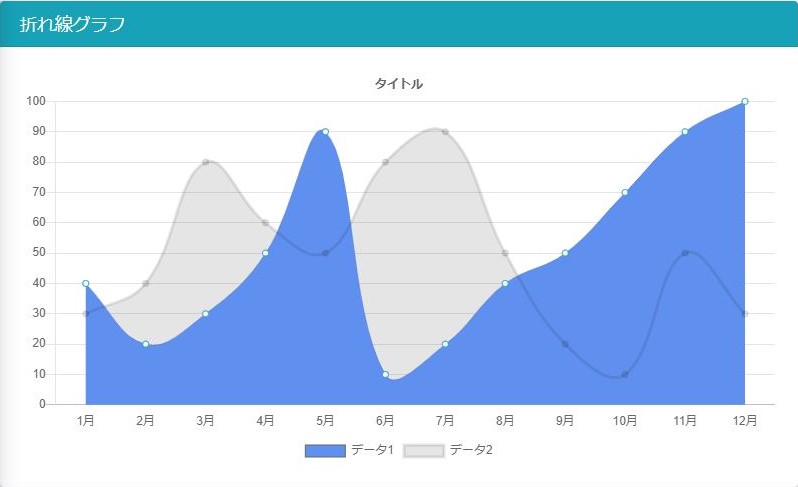
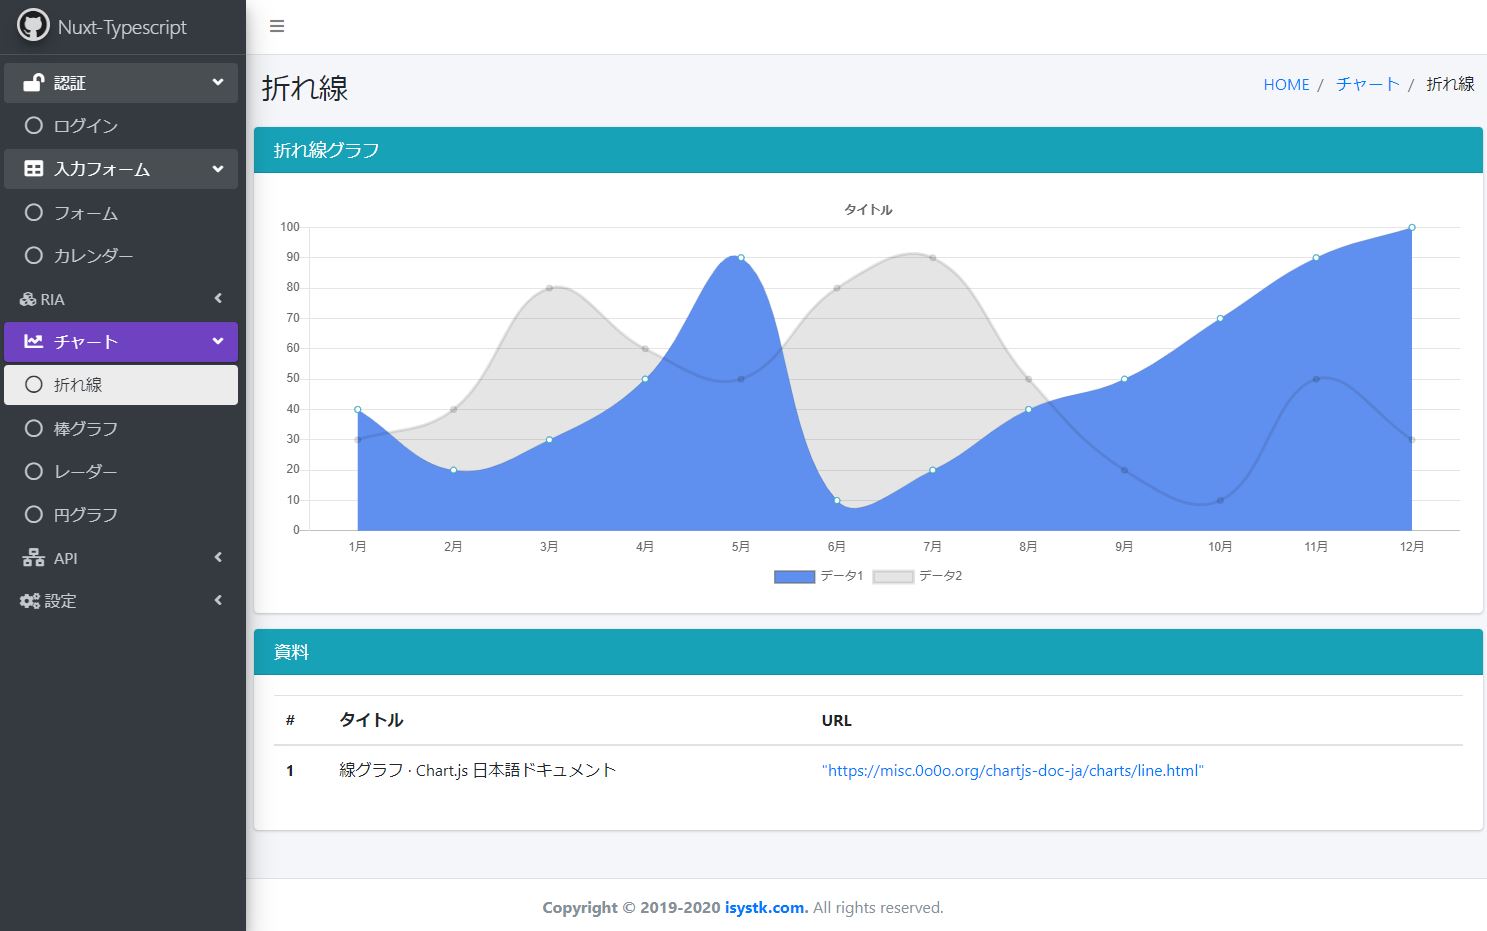
折れ線グラフは、線上にデータ点をプロットする方法です。多くの場合、トレンドデータ、または2つのデータセットの比較を表示するために使用されます。
作成したコンポーネント
ChartLineBar.vue
<script lang="ts">
import { Component, Mixins, Prop, Watch } from "vue-property-decorator";
import Chart from "chart.js";
import { Line, Bar, mixins } from "vue-chartjs";

@Component({})
export default class ChartLineBarComponent extends Mixins(
  Line,
  Bar,
  mixins.reactiveProp
) {
  @Prop()
  chartData;

  @Prop()
  options;

  mounted(): void {
    if (this.chartData) {
      this.renderChart(this.chartData, this.options);
    }
  }

  @Watch("chartData")
  onChangeData(val, old): void {
    if (this.chartData) {
      this.renderChart(this.chartData, this.options);
    }
  }
}
</script>
使い方
<template>
  <ChartLineBar
    :chart-data="chartData"
    :options="chartOptions"
  />
</template>

<script lang="ts">
import { Component, Vue, Watch, Mixins } from "vue-property-decorator";
import ChartLineBar from "@/components/chart/ChartLineBar.vue";

@Component({
  components: {
    ChartLineBar
  }
})
export default class extends Vue {
  get chartData(): Chart.ChartData {
    return {
      // データセットプロパティに関する設定
      // See https://misc.0o0o.org/chartjs-doc-ja/charts/line.html
      labels: [
        "1月",
        "2月",
        "3月",
        "4月",
        "5月",
        "6月",
        "7月",
        "8月",
        "9月",
        "10月",
        "11月",
        "12月"
      ],
      datasets: [
        {
          type: "line",
          label: "データ1", // 凡例とツールチップに表示されるデータセットのラベル
          backgroundColor: "#6090EF", // 線の下の塗りつぶしの色
          borderColor: null, // 線の色
          borderWidth: 1, // 線の幅
          pointBackgroundColor: "white", // 点の塗りつぶしの色
          pointBorderColor: "#249EBF", // 点の境界線の色
          // lineTension: 0, // 線のベジェ曲線の張力。直線を描くには0に設定します
          data: [40, 20, 30, 50, 90, 10, 20, 40, 50, 70, 90, 100]
        },
        {
          type: "line",
          label: "データ2",
          data: [30, 40, 80, 60, 50, 80, 90, 50, 20, 10, 50, 30]
        }
      ]
    } as Chart.ChartData;
  }

  get chartOptions(): Chart.ChartOptions {
    return {
      responsive: true, // コンテナサイズが変更された際に、チャートキャンバスサイズを変更します
      title: {
        // タイトル
        // See https://misc.0o0o.org/chartjs-doc-ja/configuration/title.html
        display: true, // タイトルを表示します。
        position: "top", // タイトルの位置
        fontSize: 12, // タイトルのフォントサイズ
        padding: 10, // タイトルテキストの上下に追加するピクセル数
        text: "タイトル"
      },
      legend: {
        // 凡例に関する設定
        // See https://misc.0o0o.org/chartjs-doc-ja/configuration/legend.html
        display: true, // 凡例を表示します。
        position: "bottom" // 凡例の位置
      },
      tooltips: {
        // ツールチップに関する設定
        // See https://misc.0o0o.org/chartjs-doc-ja/configuration/tooltip.html
        display: true // キャンバス上でツールチップを有効にします
      },
      elements: {
        // 要素に関する設定
        // See https://misc.0o0o.org/chartjs-doc-ja/configuration/elements.html
      },
      scales: {
        yAxes: [
          {
            stacked: false // 積み上げ面グラフを有効にする
          }
        ]
      }
    } as Chart.ChartOptions;
  }
}
</script>
折れ線グラフは、棒グラフと混在して表示することも可能です。その場合は、データセットの type: "line" を type: "bar" に変えて datasets に追加して下さい。
積み上げ面グラフ
線グラフは、y軸の積み上げ設定を有効にすることによって、積み上げ面グラフとして使うことができます。 積み上げ面グラフは、あるデータトレンドがどのような小さな要素が集まって形作られているかを示すために使用できます。
options: {
        scales: {
            yAxes: [{
                stacked: true
            }]
        }
    }
線グラフの表示を早くする方法
データの間引き
数百ピクセル幅のグラフ上に数万点のデータポイントをグラフに表示してもグラフの形状は変わらないので意味がありません。最大/最小は元データのピーク値を保持しておき、ピクセルごとに最大4つのポイントとなるようにデータを間引きすることで、チャートの見た目を変えずにパフォーマンスを向上させることが可能です。
ベジェ曲線を無効にする
チャート上に線を描画する場合は、ベジェ曲線を無効にするとレンダリング時間が短縮されます。これは、直線を描く方がベジェ曲線を描くよりもパフォーマンスに優れているためです。
options: {
    elements: {
        line: {
            tension: 0, // ベジェ曲線を無効にする
        }
    }
}
線描画を無効にする
データ点が多い場合は、データセットの線の描画を無効にし、点のみを描画するのがよりパフォーマンスに優れます。これは、キャンバスに描画するものが少なくなることを意味し、レンダリングのパフォーマンスを向上させます。
data: {
    datasets: [{
        showLine: false, // 1つのデータセットで無効にします。
    }]
},
options: {
    showLines: false, // 全てのデータセットで無効にします。
}
アニメーションを無効にする
グラフのレンダリング時間が長い場合は、アニメーションを無効にすることをお勧めします。これを行うと、更新時にグラフを何回もレンダリングする代わりに1回だけレンダリングするだけで済むことになります。これは、CPU使用率を減らし、一般的なページパフォーマンスを向上させる効果があります。
options: {
    animation: {
        duration: 0, // 一般的なアニメーションの時間
    },
    hover: {
        animationDuration: 0, // アイテムのマウスオーバー時のアニメーションの長さ
    },
    responsiveAnimationDuration: 0, // サイズ変更後のアニメーションの長さ
}
棒グラフ
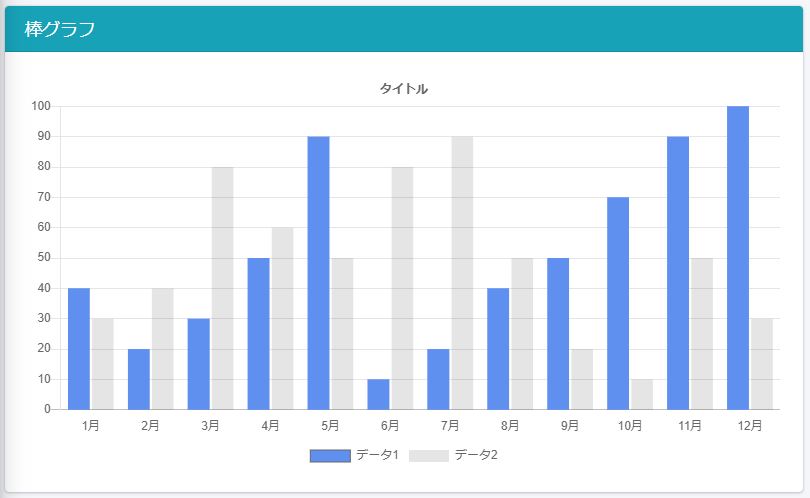
棒グラフは、データ値を縦棒で表示する方法を提供します。トレンドデータを表示するとか、複数のデータセットを並べて比較するときに使用されます。
使い方
使い方は「折れ線グラフ」と同じですが、データセットの typeを bar に変更して下さい。
  datasets: [
    {
      type: "line",
      ・・・・
    }
  ]
積み上げ棒グラフ
棒グラフは、X軸およびY軸の積み上げ設定(staked)を有効にすることにより、積み上げ棒グラフとして構成することができます。 積み上げ棒グラフを使用すると、1つのデータ系列がいくつかの小さな部分で構成されていることを示すことができます。
options: {
    scales: {
        xAxes: [{
            stacked: true
        }],
        yAxes: [{
            stacked: true
        }]
    }
}
横棒グラフ
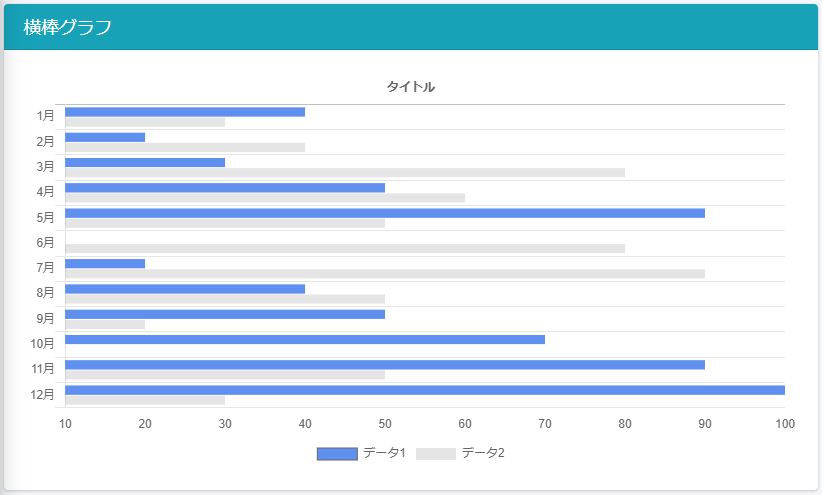
横棒グラフ(horizontal bar chart)は、縦棒グラフの別の形です。 トレンドデータを表示するとか、複数のデータセットを並べて比較するときに使用されます。
作成したコンポーネント
ChartHorizontalBar.vue
<script lang="ts">
import { Component, Mixins, Prop, Watch } from "vue-property-decorator";
import Chart from "chart.js";
import { HorizontalBar, mixins } from "vue-chartjs";

@Component({})
export default class ChartHorizontalBarComponent extends Mixins(
  HorizontalBar,
  mixins.reactiveProp
) {
  @Prop()
  chartData;

  @Prop()
  options;

  mounted(): void {
    if (this.chartData) {
      this.renderChart(this.chartData, this.options);
    }
  }

  @Watch("chartData")
  onChangeData(val, old): void {
    if (this.chartData) {
      this.renderChart(this.chartData, this.options);
    }
  }
}
</script>
使い方
<template>
  <ChartHorizontalBar
    :chart-data="chartData"
    :options="chartOptions"
  />
</template>

<script lang="ts">
import { Component, Vue, Watch, Mixins } from "vue-property-decorator";
import ChartHorizontalBar from "@/components/chart/ChartHorizontalBar.vue";

@Component({
  components: {
    ChartHorizontalBar
  }
})
export default class extends Vue {
  get chartData(): Chart.ChartData {
    return {
      // データセットプロパティに関する設定
      // See https://misc.0o0o.org/chartjs-doc-ja/charts/bar.html
      labels: [
        "1月",
        "2月",
        "3月",
        "4月",
        "5月",
        "6月",
        "7月",
        "8月",
        "9月",
        "10月",
        "11月",
        "12月"
      ],
      datasets: [
        {
          label: "データ1", // 凡例とツールチップに表示されるデータセットのラベル
          backgroundColor: "#6090EF", // 線の下の塗りつぶしの色
          borderColor: null, // 線の色
          borderWidth: 1, // 線の幅
          pointBackgroundColor: "white", // 点の塗りつぶしの色
          pointBorderColor: "#249EBF", // 点の境界線の色
          // lineTension: 0, // 線のベジェ曲線の張力。直線を描くには0に設定します
          data: [40, 20, 30, 50, 90, 10, 20, 40, 50, 70, 90, 100]
        },
        {
          label: "データ2",
          data: [30, 40, 80, 60, 50, 80, 90, 50, 20, 10, 50, 30]
        }
      ]
    } as Chart.ChartData;
  }

  get chartOptions(): Chart.ChartOptions {
    return {
      responsive: true, // コンテナサイズが変更された際に、チャートキャンバスサイズを変更します
      title: {
        // タイトル
        // See https://misc.0o0o.org/chartjs-doc-ja/configuration/title.html
        display: true, // タイトルを表示します。
        position: "top", // タイトルの位置
        fontSize: 12, // タイトルのフォントサイズ
        padding: 10, // タイトルテキストの上下に追加するピクセル数
        text: "タイトル"
      },
      legend: {
        // 凡例に関する設定
        // See https://misc.0o0o.org/chartjs-doc-ja/configuration/legend.html
        display: true, // 凡例を表示します。
        position: "bottom" // 凡例の位置
      },
      tooltips: {
        // ツールチップに関する設定
        // See https://misc.0o0o.org/chartjs-doc-ja/configuration/tooltip.html
        display: true // キャンバス上でツールチップを有効にします
      },
      elements: {
        // 要素に関する設定
        // See https://misc.0o0o.org/chartjs-doc-ja/configuration/elements.html
      }
    } as Chart.ChartOptions;
  }
}
</script>
レーダーチャート
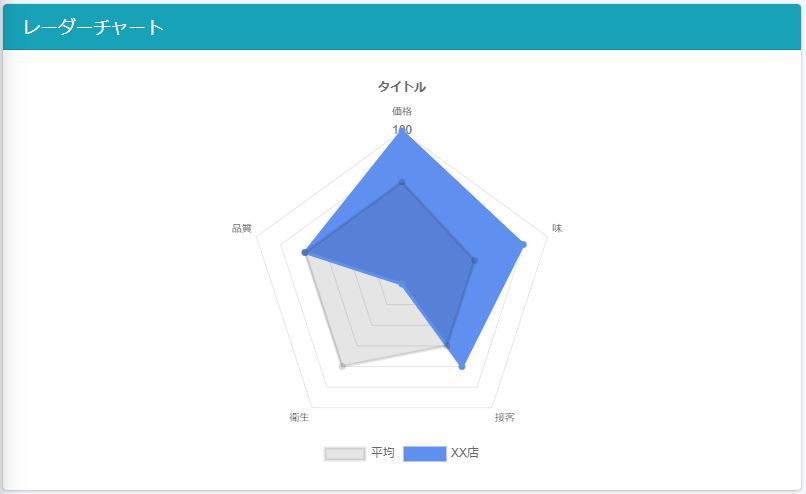
レーダーチャートは、複数のデータ点とそれらの間の変動を表示する方法です。これらは、2つ以上の異なるデータセットを比較する場合によく使用されます。
作成したコンポーネント
ChartRadar.vue
<script lang="ts">
import { Component, Mixins, Prop, Watch } from "vue-property-decorator";
import Chart from "chart.js";
import { Radar, mixins } from "vue-chartjs";

@Component({})
export default class ChartRadarComponent extends Mixins(
  Radar,
  mixins.reactiveProp
) {
  @Prop()
  chartData;

  @Prop()
  options;

  mounted(): void {
    if (this.chartData) {
      this.renderChart(this.chartData, this.options);
    }
  }

  @Watch("chartData")
  onChangeData(val, old): void {
    if (this.chartData) {
      this.renderChart(this.chartData, this.options);
    }
  }
}
</script>
使い方
<template>
  <ChartRadar
    :chart-data="chartData"
    :options="chartOptions"
  />
</template>

<script lang="ts">
import { Component, Vue, Watch, Mixins } from "vue-property-decorator";
import ChartRadar from "@/components/chart/ChartRadar.vue";

@Component({
  components: {
    ChartRadar
  }
})
export default class extends Vue {

  get chartData(): Chart.ChartData | null {
    return {
      // データセットプロパティに関する設定
      // See https://misc.0o0o.org/chartjs-doc-ja/charts/radar.html
      labels: ["価格", "味", "接客", "衛生", "品質"],
      datasets: [
        {
          label: "平均",
          data: [80, 70, 70, 80, 80]
        },
        {
          label: "XX店",
          backgroundColor: "#6090EF",
          borderColor: "#6090EF",
          data: [100, 90, 80, 40, 80]
        }
      ]
    } as Chart.ChartData;
  }

  get chartOptions(): Chart.ChartOptions {
    return {
      responsive: true, // コンテナサイズが変更された際に、チャートキャンバスサイズを変更します
      responsiveAnimationDuration: 0, // サイズ変更イベント後に新しいサイズにアニメーションするのに要する時間(ミリ秒)
      maintainAspectRatio: false, // サイズ変更の際に、元のキャンバスのアスペクト比(width / height)を維持します。
      // onResize(chart, size): void {
      //   // サイズ変更が発生したときに呼び出されます。チャートインスタンスと新しいサイズの2つの引数を渡します。
      // },
      layout: {
        // レイアウトに関する設定
        // See https://misc.0o0o.org/chartjs-doc-ja/configuration/layout.html
        padding: 0 // グラフの内側に追加するパディング
      },
      title: {
        // タイトル
        // See https://misc.0o0o.org/chartjs-doc-ja/configuration/title.html
        display: true, // タイトルを表示します。
        position: "top", // タイトルの位置
        fontSize: 12, // タイトルのフォントサイズ
        padding: 10, // タイトルテキストの上下に追加するピクセル数
        text: "タイトル"
      },
      legend: {
        // 凡例に関する設定
        // See https://misc.0o0o.org/chartjs-doc-ja/configuration/legend.html
        display: true, // 凡例を表示します。
        position: "bottom" // 凡例の位置
      },
      tooltips: {
        // ツールチップに関する設定
        // See https://misc.0o0o.org/chartjs-doc-ja/configuration/tooltip.html
        display: true // キャンバス上でツールチップを有効にします
      },
      elements: {
        // 要素に関する設定
        // See https://misc.0o0o.org/chartjs-doc-ja/configuration/elements.html
        point: {
          // 点に関する設定
        },
        line: {
          // 線に関する設定
        },
        rectangle: {
          // 矩形に関する設定
        },
        arc: {
          // 円弧に関する設定
        }
      },
      scale: {
        angleLines: {
          display: false
        },
        ticks: {
          suggestedMin: 50,
          suggestedMax: 100
        }
      }
    } as Chart.ChartOptions;
  }
}
</script>
円グラフ
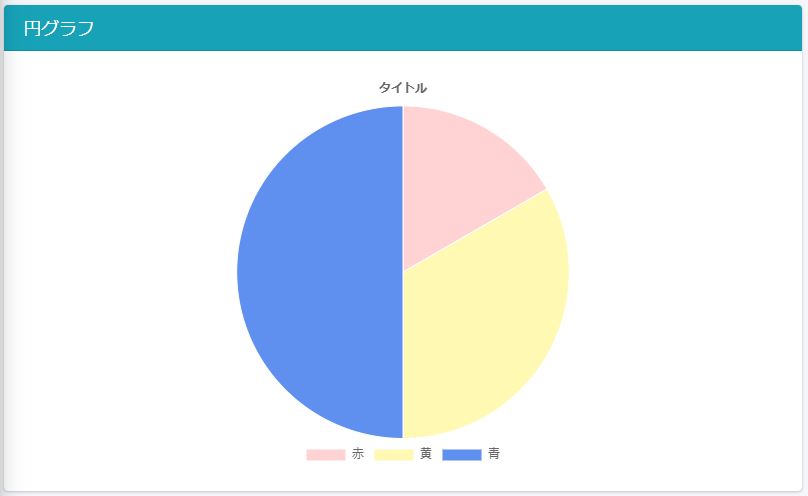
円グラフ(パイチャート)は、おそらく最も一般的に使われるチャートです。 円は弧に分割され、各部分は対応するデータの比例値を示します。これらは、データ間の比率関係を示すのに優れています。
作成したコンポーネント
ChartPie.vue
<script lang="ts">
import { Component, Mixins, Prop, Watch } from "vue-property-decorator";
import Chart from "chart.js";
import { Pie, mixins } from "vue-chartjs";

@Component({})
export default class ChartPieComponent extends Mixins(
  Pie,
  mixins.reactiveProp
) {
  @Prop()
  chartData;

  @Prop()
  options;

  mounted(): void {
    if (this.chartData) {
      this.renderChart(this.chartData, this.options);
    }
  }

  @Watch("chartData")
  onChangeData(val, old): void {
    if (this.chartData) {
      this.renderChart(this.chartData, this.options);
    }
  }
}
</script>
使い方
<template>
  <ChartPie
    :chart-data="chartData"
    :options="chartOptions"
  />
</template>

<script lang="ts">
import { Component, Vue, Watch, Mixins } from "vue-property-decorator";
import ChartPie from "@/components/chart/ChartPie.vue";

@Component({
  components: {
    ChartPie
  }
})
export default class extends Vue {

  get chartData(): Chart.ChartData | null {
    return {
      // データセットプロパティに関する設定
      // See https://misc.0o0o.org/chartjs-doc-ja/charts/doughnut.html#%E3%83%87%E3%83%BC%E3%82%BF%E3%82%BB%E3%83%83%E3%83%88%E3%83%97%E3%83%AD%E3%83%91%E3%83%86%E3%82%A3
      datasets: [
        {
          backgroundColor: ["#ffd3d3", "#fff9b4", "#6090EF"], // データセットの円弧の塗りつぶし色
          borderColor: "#FFFFFF", // データセットの円弧の境界線の色データセットの円弧の塗りつぶし色
          borderWidth: 1, // データセットの円弧の境界線の太さ
          // hoverBackgroundColor: "#ececec", // マウスオーバー時の円弧の塗りつぶし色
          // hoverBorderColor: "#ececec", // マウスオーバー時の境界線の色
          // hoverBorderWidth: 2, // マウスオーバー時の境界線の太さ
          data: [10, 20, 30] // データ値
        }
      ],
      labels: ["赤", "黄", "青"] // 凡例とツールチップに表示するラベル
    } as Chart.ChartData;
  }

  get chartOptions(): Chart.ChartOptions {
    return {
      responsive: true, // コンテナサイズが変更された際に、チャートキャンバスサイズを変更します
      responsiveAnimationDuration: 0, // サイズ変更イベント後に新しいサイズにアニメーションするのに要する時間(ミリ秒)
      maintainAspectRatio: false, // サイズ変更の際に、元のキャンバスのアスペクト比(width / height)を維持します。
      // onResize(chart, size): void {
      //   // サイズ変更が発生したときに呼び出されます。チャートインスタンスと新しいサイズの2つの引数を渡します。
      // },
      layout: {
        // レイアウトに関する設定
        // See https://misc.0o0o.org/chartjs-doc-ja/configuration/layout.html
        padding: 0 // グラフの内側に追加するパディング
      },
      title: {
        // タイトル
        // See https://misc.0o0o.org/chartjs-doc-ja/configuration/title.html
        display: true, // タイトルを表示します。
        position: "top", // タイトルの位置
        fontSize: 12, // タイトルのフォントサイズ
        padding: 10, // タイトルテキストの上下に追加するピクセル数
        text: "タイトル"
      },
      legend: {
        // 凡例に関する設定
        // See https://misc.0o0o.org/chartjs-doc-ja/configuration/legend.html
        display: true, // 凡例を表示します。
        position: "bottom" // 凡例の位置
      },
      tooltips: {
        // ツールチップに関する設定
        // See https://misc.0o0o.org/chartjs-doc-ja/configuration/tooltip.html
        display: true // キャンバス上でツールチップを有効にします
      },
      elements: {
        // 要素に関する設定
        // See https://misc.0o0o.org/chartjs-doc-ja/configuration/elements.html
        point: {
          // 点に関する設定
        },
        line: {
          // 線に関する設定
        },
        rectangle: {
          // 矩形に関する設定
        },
        arc: {
          // 円弧に関する設定
        }
      },
      animation: {
        // アニメーションに関する設定
        // See https://misc.0o0o.org/chartjs-doc-ja/configuration/animations.html
        duration: 1000, // アニメーションにかける時間(ミリ秒)
        easing: "easeOutQuart", // 使用するイージング(easing)(訳注:アニメーションの効果
        // onProgress: null, // アニメーションの各ステップで呼び出されるコールバック
        // onComplete: null, // アニメーションの最後に呼び出されるコールバック
        animateRotate: true, // (円グラフ)trueの場合、グラフは回転アニメーションをします。
        animateScale: true // (円グラフ)trueの場合、中央から外側に向かってグラフが拡大するアニメーションをします。
      },
      rotation: -0.5 * Math.PI, // (円グラフ)弧を描画する開始角度
      circumference: 2 * Math.PI // (円グラフ)弧全体の角度
      // cutoutPercentage: 50, // (ドーナツ)中央部から切り取られるグラフの割合
      // startAngle: -0.5 * Math.PI // (鶏頭図のみ) データセットの最初の項目の円弧を描画する開始角度
    } as Chart.ChartOptions;
  }
}
</script>
ドーナツチャート
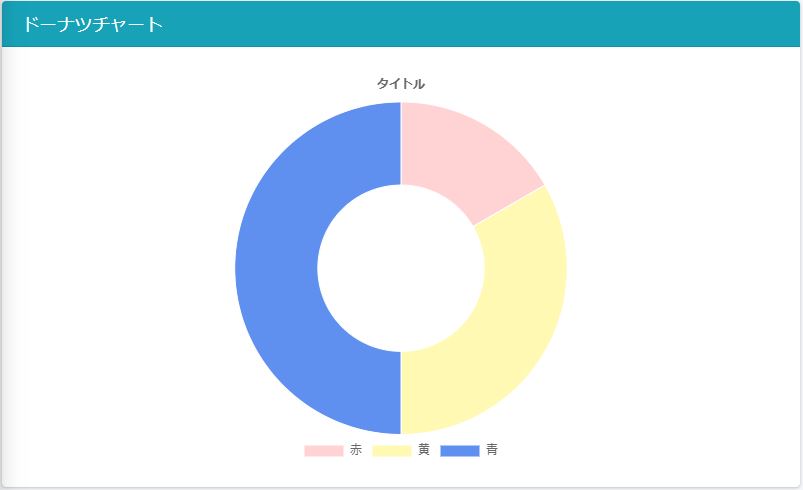
ドーナツチャートは円グラフと本質的にChart.jsの同じクラスを使用していますが、cutoutPercentageについてのみ異なる初期値を持っています。これはグラフの何パーセントを内側から切り取るかを指定します。円グラフでは「0」、ドーナツチャートでは「50」となっています。
これらのグラフはChartコアのエイリアスとしても別々に登録されています。異なるデフォルト値と異なるエイリアス以外は、まったく同じです。
作成したコンポーネント
ChartDoughnut.vue
<script lang="ts">
import { Component, Mixins, Prop, Watch } from "vue-property-decorator";
import Chart from "chart.js";
import { Doughnut, mixins } from "vue-chartjs";

@Component({})
export default class ChartDoughnutComponent extends Mixins(
  Doughnut,
  mixins.reactiveProp
) {
  @Prop()
  chartData;

  @Prop()
  options;

  mounted(): void {
    if (this.chartData) {
      this.renderChart(this.chartData, this.options);
    }
  }

  @Watch("chartData")
  onChangeData(val, old): void {
    if (this.chartData) {
      this.renderChart(this.chartData, this.options);
    }
  }
}
</script>
使い方
<template>
  <ChartDoughnut
    :chart-data="chartData"
    :options="chartOptions"
  />
</template>

<script lang="ts">
import { Component, Vue, Watch, Mixins } from "vue-property-decorator";
import ChartDoughnut from "@/components/chart/ChartDoughnut.vue";

@Component({
  components: {
    ChartDoughnut
  }
})
export default class extends Vue {

  get chartData(): Chart.ChartData | null {
    return {
      // データセットプロパティに関する設定
      // See https://misc.0o0o.org/chartjs-doc-ja/charts/doughnut.html#%E3%83%87%E3%83%BC%E3%82%BF%E3%82%BB%E3%83%83%E3%83%88%E3%83%97%E3%83%AD%E3%83%91%E3%83%86%E3%82%A3
      datasets: [
        {
          backgroundColor: ["#ffd3d3", "#fff9b4", "#6090EF"], // データセットの円弧の塗りつぶし色
          borderColor: "#FFFFFF", // データセットの円弧の境界線の色データセットの円弧の塗りつぶし色
          borderWidth: 1, // データセットの円弧の境界線の太さ
          // hoverBackgroundColor: "#ececec", // マウスオーバー時の円弧の塗りつぶし色
          // hoverBorderColor: "#ececec", // マウスオーバー時の境界線の色
          // hoverBorderWidth: 2, // マウスオーバー時の境界線の太さ
          data: [10, 20, 30] // データ値
        }
      ],
      labels: ["赤", "黄", "青"] // 凡例とツールチップに表示するラベル
    } as Chart.ChartData;
  }

  get chartOptions(): Chart.ChartOptions {
    return {
      responsive: true, // コンテナサイズが変更された際に、チャートキャンバスサイズを変更します
      responsiveAnimationDuration: 0, // サイズ変更イベント後に新しいサイズにアニメーションするのに要する時間(ミリ秒)
      maintainAspectRatio: false, // サイズ変更の際に、元のキャンバスのアスペクト比(width / height)を維持します。
      // onResize(chart, size): void {
      //   // サイズ変更が発生したときに呼び出されます。チャートインスタンスと新しいサイズの2つの引数を渡します。
      // },
      layout: {
        // レイアウトに関する設定
        // See https://misc.0o0o.org/chartjs-doc-ja/configuration/layout.html
        padding: 0 // グラフの内側に追加するパディング
      },
      title: {
        // タイトル
        // See https://misc.0o0o.org/chartjs-doc-ja/configuration/title.html
        display: true, // タイトルを表示します。
        position: "top", // タイトルの位置
        fontSize: 12, // タイトルのフォントサイズ
        padding: 10, // タイトルテキストの上下に追加するピクセル数
        text: "タイトル"
      },
      legend: {
        // 凡例に関する設定
        // See https://misc.0o0o.org/chartjs-doc-ja/configuration/legend.html
        display: true, // 凡例を表示します。
        position: "bottom" // 凡例の位置
      },
      tooltips: {
        // ツールチップに関する設定
        // See https://misc.0o0o.org/chartjs-doc-ja/configuration/tooltip.html
        display: true // キャンバス上でツールチップを有効にします
      },
      elements: {
        // 要素に関する設定
        // See https://misc.0o0o.org/chartjs-doc-ja/configuration/elements.html
        point: {
          // 点に関する設定
        },
        line: {
          // 線に関する設定
        },
        rectangle: {
          // 矩形に関する設定
        },
        arc: {
          // 円弧に関する設定
        }
      },
      animation: {
        // アニメーションに関する設定
        // See https://misc.0o0o.org/chartjs-doc-ja/configuration/animations.html
        duration: 1000, // アニメーションにかける時間(ミリ秒)
        easing: "easeOutQuart", // 使用するイージング(easing)(訳注:アニメーションの効果
        // onProgress: null, // アニメーションの各ステップで呼び出されるコールバック
        // onComplete: null, // アニメーションの最後に呼び出されるコールバック
        animateRotate: true, // (円グラフ)trueの場合、グラフは回転アニメーションをします。
        animateScale: true // (円グラフ)trueの場合、中央から外側に向かってグラフが拡大するアニメーションをします。
      },
      rotation: -0.5 * Math.PI, // (円グラフ)弧を描画する開始角度
      circumference: 2 * Math.PI // (円グラフ)弧全体の角度
      // cutoutPercentage: 50, // (ドーナツ)中央部から切り取られるグラフの割合
      // startAngle: -0.5 * Math.PI // (鶏頭図のみ) データセットの最初の項目の円弧を描画する開始角度
    } as Chart.ChartOptions;
  }
}
</script>
鶏頭図
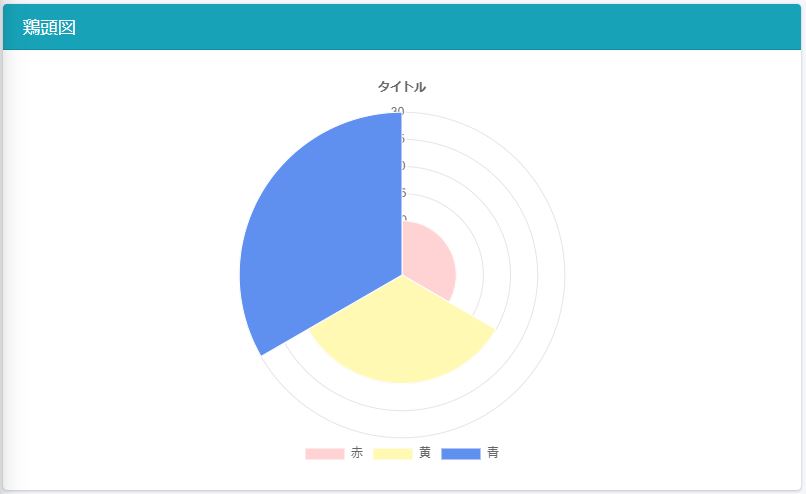
鶏頭図(polar area chart)は円グラフと似ていますが、各弧の角度は同じです。弧の半径は値によって異なります。
この形式のグラフは、円グラフと同様にデータを比較する際に便利というだけでなく、値の規模を比較したい場合に便利です。
作成したコンポーネント
ChartPolar.vue
<script lang="ts">
import { Component, Mixins, Prop, Watch } from "vue-property-decorator";
import Chart from "chart.js";
import { PolarArea, mixins } from "vue-chartjs";

@Component({})
export default class ChartPolarComponent extends Mixins(
  PolarArea,
  mixins.reactiveProp
) {
  @Prop()
  chartData;

  @Prop()
  options;

  mounted(): void {
    if (this.chartData) {
      this.renderChart(this.chartData, this.options);
    }
  }

  @Watch("chartData")
  onChangeData(val, old): void {
    if (this.chartData) {
      this.renderChart(this.chartData, this.options);
    }
  }
}
</script>
使い方
<template>
  <ChartPolar
    :chart-data="chartData"
    :options="chartOptions"
  />
</template>

<script lang="ts">
import { Component, Vue, Watch, Mixins } from "vue-property-decorator";
import ChartPolar from "@/components/chart/ChartPolar.vue";

@Component({
  components: {
    ChartPolar
  }
})
export default class extends Vue {

  get chartData(): Chart.ChartData | null {
    return {
      // データセットプロパティに関する設定
      // See https://misc.0o0o.org/chartjs-doc-ja/charts/doughnut.html#%E3%83%87%E3%83%BC%E3%82%BF%E3%82%BB%E3%83%83%E3%83%88%E3%83%97%E3%83%AD%E3%83%91%E3%83%86%E3%82%A3
      datasets: [
        {
          backgroundColor: ["#ffd3d3", "#fff9b4", "#6090EF"], // データセットの円弧の塗りつぶし色
          borderColor: "#FFFFFF", // データセットの円弧の境界線の色データセットの円弧の塗りつぶし色
          borderWidth: 1, // データセットの円弧の境界線の太さ
          // hoverBackgroundColor: "#ececec", // マウスオーバー時の円弧の塗りつぶし色
          // hoverBorderColor: "#ececec", // マウスオーバー時の境界線の色
          // hoverBorderWidth: 2, // マウスオーバー時の境界線の太さ
          data: [10, 20, 30] // データ値
        }
      ],
      labels: ["赤", "黄", "青"] // 凡例とツールチップに表示するラベル
    } as Chart.ChartData;
  }

  get chartOptions(): Chart.ChartOptions {
    return {
      responsive: true, // コンテナサイズが変更された際に、チャートキャンバスサイズを変更します
      responsiveAnimationDuration: 0, // サイズ変更イベント後に新しいサイズにアニメーションするのに要する時間(ミリ秒)
      maintainAspectRatio: false, // サイズ変更の際に、元のキャンバスのアスペクト比(width / height)を維持します。
      // onResize(chart, size): void {
      //   // サイズ変更が発生したときに呼び出されます。チャートインスタンスと新しいサイズの2つの引数を渡します。
      // },
      layout: {
        // レイアウトに関する設定
        // See https://misc.0o0o.org/chartjs-doc-ja/configuration/layout.html
        padding: 0 // グラフの内側に追加するパディング
      },
      title: {
        // タイトル
        // See https://misc.0o0o.org/chartjs-doc-ja/configuration/title.html
        display: true, // タイトルを表示します。
        position: "top", // タイトルの位置
        fontSize: 12, // タイトルのフォントサイズ
        padding: 10, // タイトルテキストの上下に追加するピクセル数
        text: "タイトル"
      },
      legend: {
        // 凡例に関する設定
        // See https://misc.0o0o.org/chartjs-doc-ja/configuration/legend.html
        display: true, // 凡例を表示します。
        position: "bottom" // 凡例の位置
      },
      tooltips: {
        // ツールチップに関する設定
        // See https://misc.0o0o.org/chartjs-doc-ja/configuration/tooltip.html
        display: true // キャンバス上でツールチップを有効にします
      },
      elements: {
        // 要素に関する設定
        // See https://misc.0o0o.org/chartjs-doc-ja/configuration/elements.html
        point: {
          // 点に関する設定
        },
        line: {
          // 線に関する設定
        },
        rectangle: {
          // 矩形に関する設定
        },
        arc: {
          // 円弧に関する設定
        }
      },
      animation: {
        // アニメーションに関する設定
        // See https://misc.0o0o.org/chartjs-doc-ja/configuration/animations.html
        duration: 1000, // アニメーションにかける時間(ミリ秒)
        easing: "easeOutQuart", // 使用するイージング(easing)(訳注:アニメーションの効果
        // onProgress: null, // アニメーションの各ステップで呼び出されるコールバック
        // onComplete: null, // アニメーションの最後に呼び出されるコールバック
        animateRotate: true, // (円グラフ)trueの場合、グラフは回転アニメーションをします。
        animateScale: true // (円グラフ)trueの場合、中央から外側に向かってグラフが拡大するアニメーションをします。
      },
      rotation: -0.5 * Math.PI, // (円グラフ)弧を描画する開始角度
      circumference: 2 * Math.PI // (円グラフ)弧全体の角度
      // cutoutPercentage: 50, // (ドーナツ)中央部から切り取られるグラフの割合
      // startAngle: -0.5 * Math.PI // (鶏頭図のみ) データセットの最初の項目の円弧を描画する開始角度
    } as Chart.ChartOptions;
  }
}
</script>


[…] Vue-Chartjs の使い方とサンプル(Typescript対応版) […]